
Over het geluk in de wereld in 2020 wordt gerapporteerd in het 8e World Happiness Report. In het voorwoord geven de samenstellers aan hoe het zover gekomen is:
“The first seven reports were produced by the founding trio of co-editors assembled in Thimphu in July 2011 pursuant to the Bhutanese Resolution passed by the General
Assembly in June 2011, that invited national governments to “give more importance to happiness and well-being in determining how to achieve and measure social and economic development.” The Thimphu meeting, chaired by Prime Minister Jigme Y. Thinley and Jeffrey D. Sachs, was called to plan for a United Nations High-Level Meeting on ‘Well-Being and Happiness: Defining a New Economic Paradigm’ held at the UN on April 2, 2012. The first World Happiness Report was prepared in support of that meeting, bringing together the available global data on national happiness and reviewing evidence from the emerging science of happiness.”
Het rapport baseert zich op de data die steeds meer landen beschikbaar stellen. Maar de basis wordt gevormd door de data uit de jaarlijkse Gallup World Poll. Ze gaan in 2020 nog een stapje verder, want: “From 2020, Gallup will be a full data partner,
in recognition of the importance of the Gallup World Poll to the contents and reach of the World Happiness Report.“
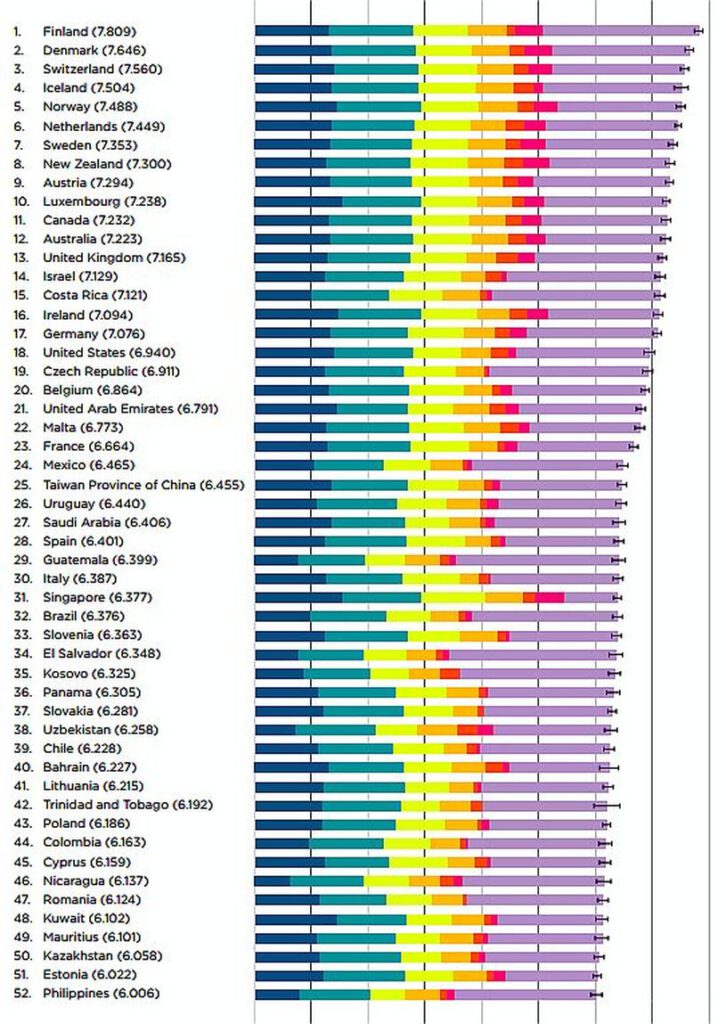
De bovenkant van de Happiness ranglijst
We zien dat Nederland, in vergelijking met vorig jaar, één plaats is gezakt! Verder is de Top 20 hetzelfde als vorig jaar alleen is er onderling hier en daar van plaats gewisseld.
Het WHR is nu 8 keer uitgebracht en vier verschillende landen hebben op de hoogste positie gestaan: Denemarken in 2012, 2013 en 2016, Zwitserland in 2015, Noorwegen in 2017 en Finland in 2018, 2019 en 2020.
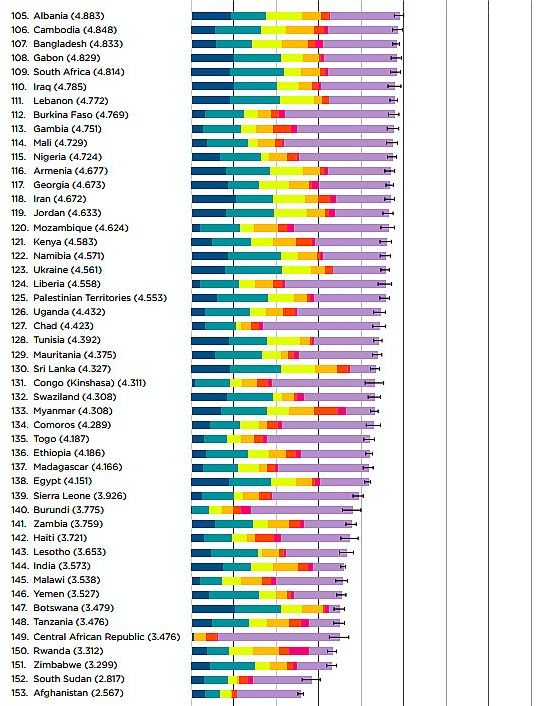
En dit zijn de minder gefortuneerde landen aan de onderkant van de lijst:
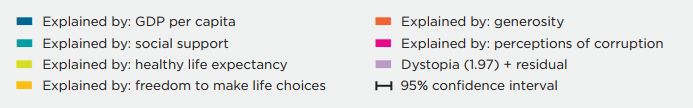
GDP per capita
Gross Domestic Product per hoofd van de bevolking. Het is een uitdrukking van de marktwaarde van alle gereed produkten en services die gemiddeld per hoofd van de bevolking worden geproduceerd in een gegeven periode.
Wel moeten we ons realiseren dat hiermee de verschillen in de kosten voor levens-onderhoud en de inflatie tussen landen niet zichtbaar worden!
“GDP per capita is in terms of Purchasing Power Parity (PPP) adjusted to constant
2011 international dollars, taken from the World Development Indicators (WDI) released by the World Bank on November 28, 2019.”
Social Support
Het gevoel dat er ondersteuning is vanuit de gemeenschap.
“Social support is the national average of the binary responses (0=no, 1=yes) to
the Gallup World Poll (GWP) question, “If you were in trouble, do you have relatives
or friends you can count on to help you whenever you need them, or not?”.”
Healthy Life Expectancy
Wat is de verwachting ten aanzien van een gezonde levensweg en de lengte daarvan?
“The time series of healthy life expectancy at birth are constructed based on data
from the World Health Organization (WHO) Global Health Observatory data
repository, with data available for 2005, 2010, 2015, and 2016. To match this
report’s sample period, interpolation and extrapolation are used.”
Freedom to make life choices
In hoeverre voelt men zich vrij om over eigen leven te beschikken?
“Freedom to make life choices is the national average of binary responses
to the GWP question, “Are you satisfied or dissatisfied with your freedom to
choose what you do with your life?”.”
Generosity
Hoe staat het met de vrijgevigheid in het land?
“Generosity is the residual of regressing the national average of GWP responses
to the question, “Have you donated money to a charity in the past month?” on GDP per capita.“
Perception of corruption
In hoeverre neemt de burger waar dat er van corruptie sprake is. Let wel: het gaat om gewaar worden; het moet gezien of gevoeld worden!
“Perceptions of corruption are the average of binary answers to two GWP questions:
“Is corruption widespread throughout the government or not?” and “Is corruption
widespread within businesses or not?” Where data for government corruption
are missing, the perception of business corruption is used as the overall corruption-perception measure.“
Dystopia
Dat is de lastigste. Laten we het World Happiness Report 2020 zelf antwoord geven:
“Dystopia is an imaginary country that has the world’s least-happy people. The purpose in establishing Dystopia is to have a benchmark against which all countries can be favorably compared (no country performs more poorly than Dystopia) in terms of each of the six key variables, thus allowing each sub-bar to be of positive (or zero, in six instances) width. The lowest scores observed for the six key variables, therefore, characterize Dystopia. Since life would be very unpleasant in a country with the world’s lowest incomes, lowest life expectancy, lowest generosity, most corruption, least freedom, and least social support, it is referred to as “Dystopia,” in contrast to Utopia.”